Here you'll find important information about our University community.
Our students
We had a total of 14,039 UK-based higher education students in 2023–24, of which:
-
54% were undergraduate / 46% were postgraduate
-
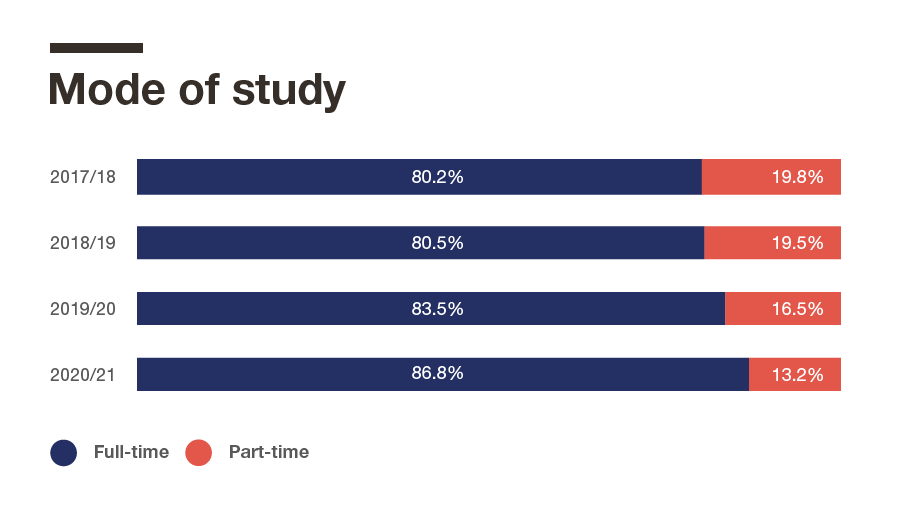
79% were studying full-time / 21% were studying part-time
-
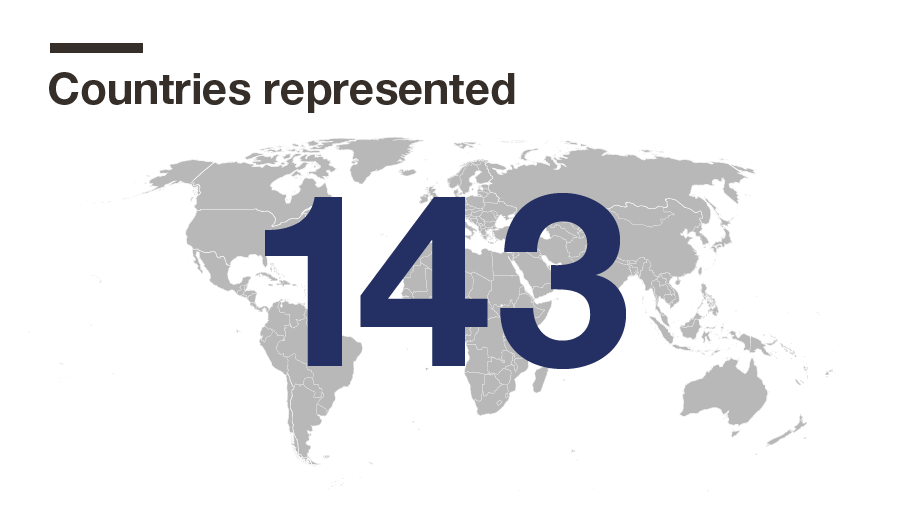
150 distinct nationalities were represented
-
71% of students were mature
-
61% of students identified as female
-
66% of students were from a minoritised background
-
13% had a known disability
Our staff
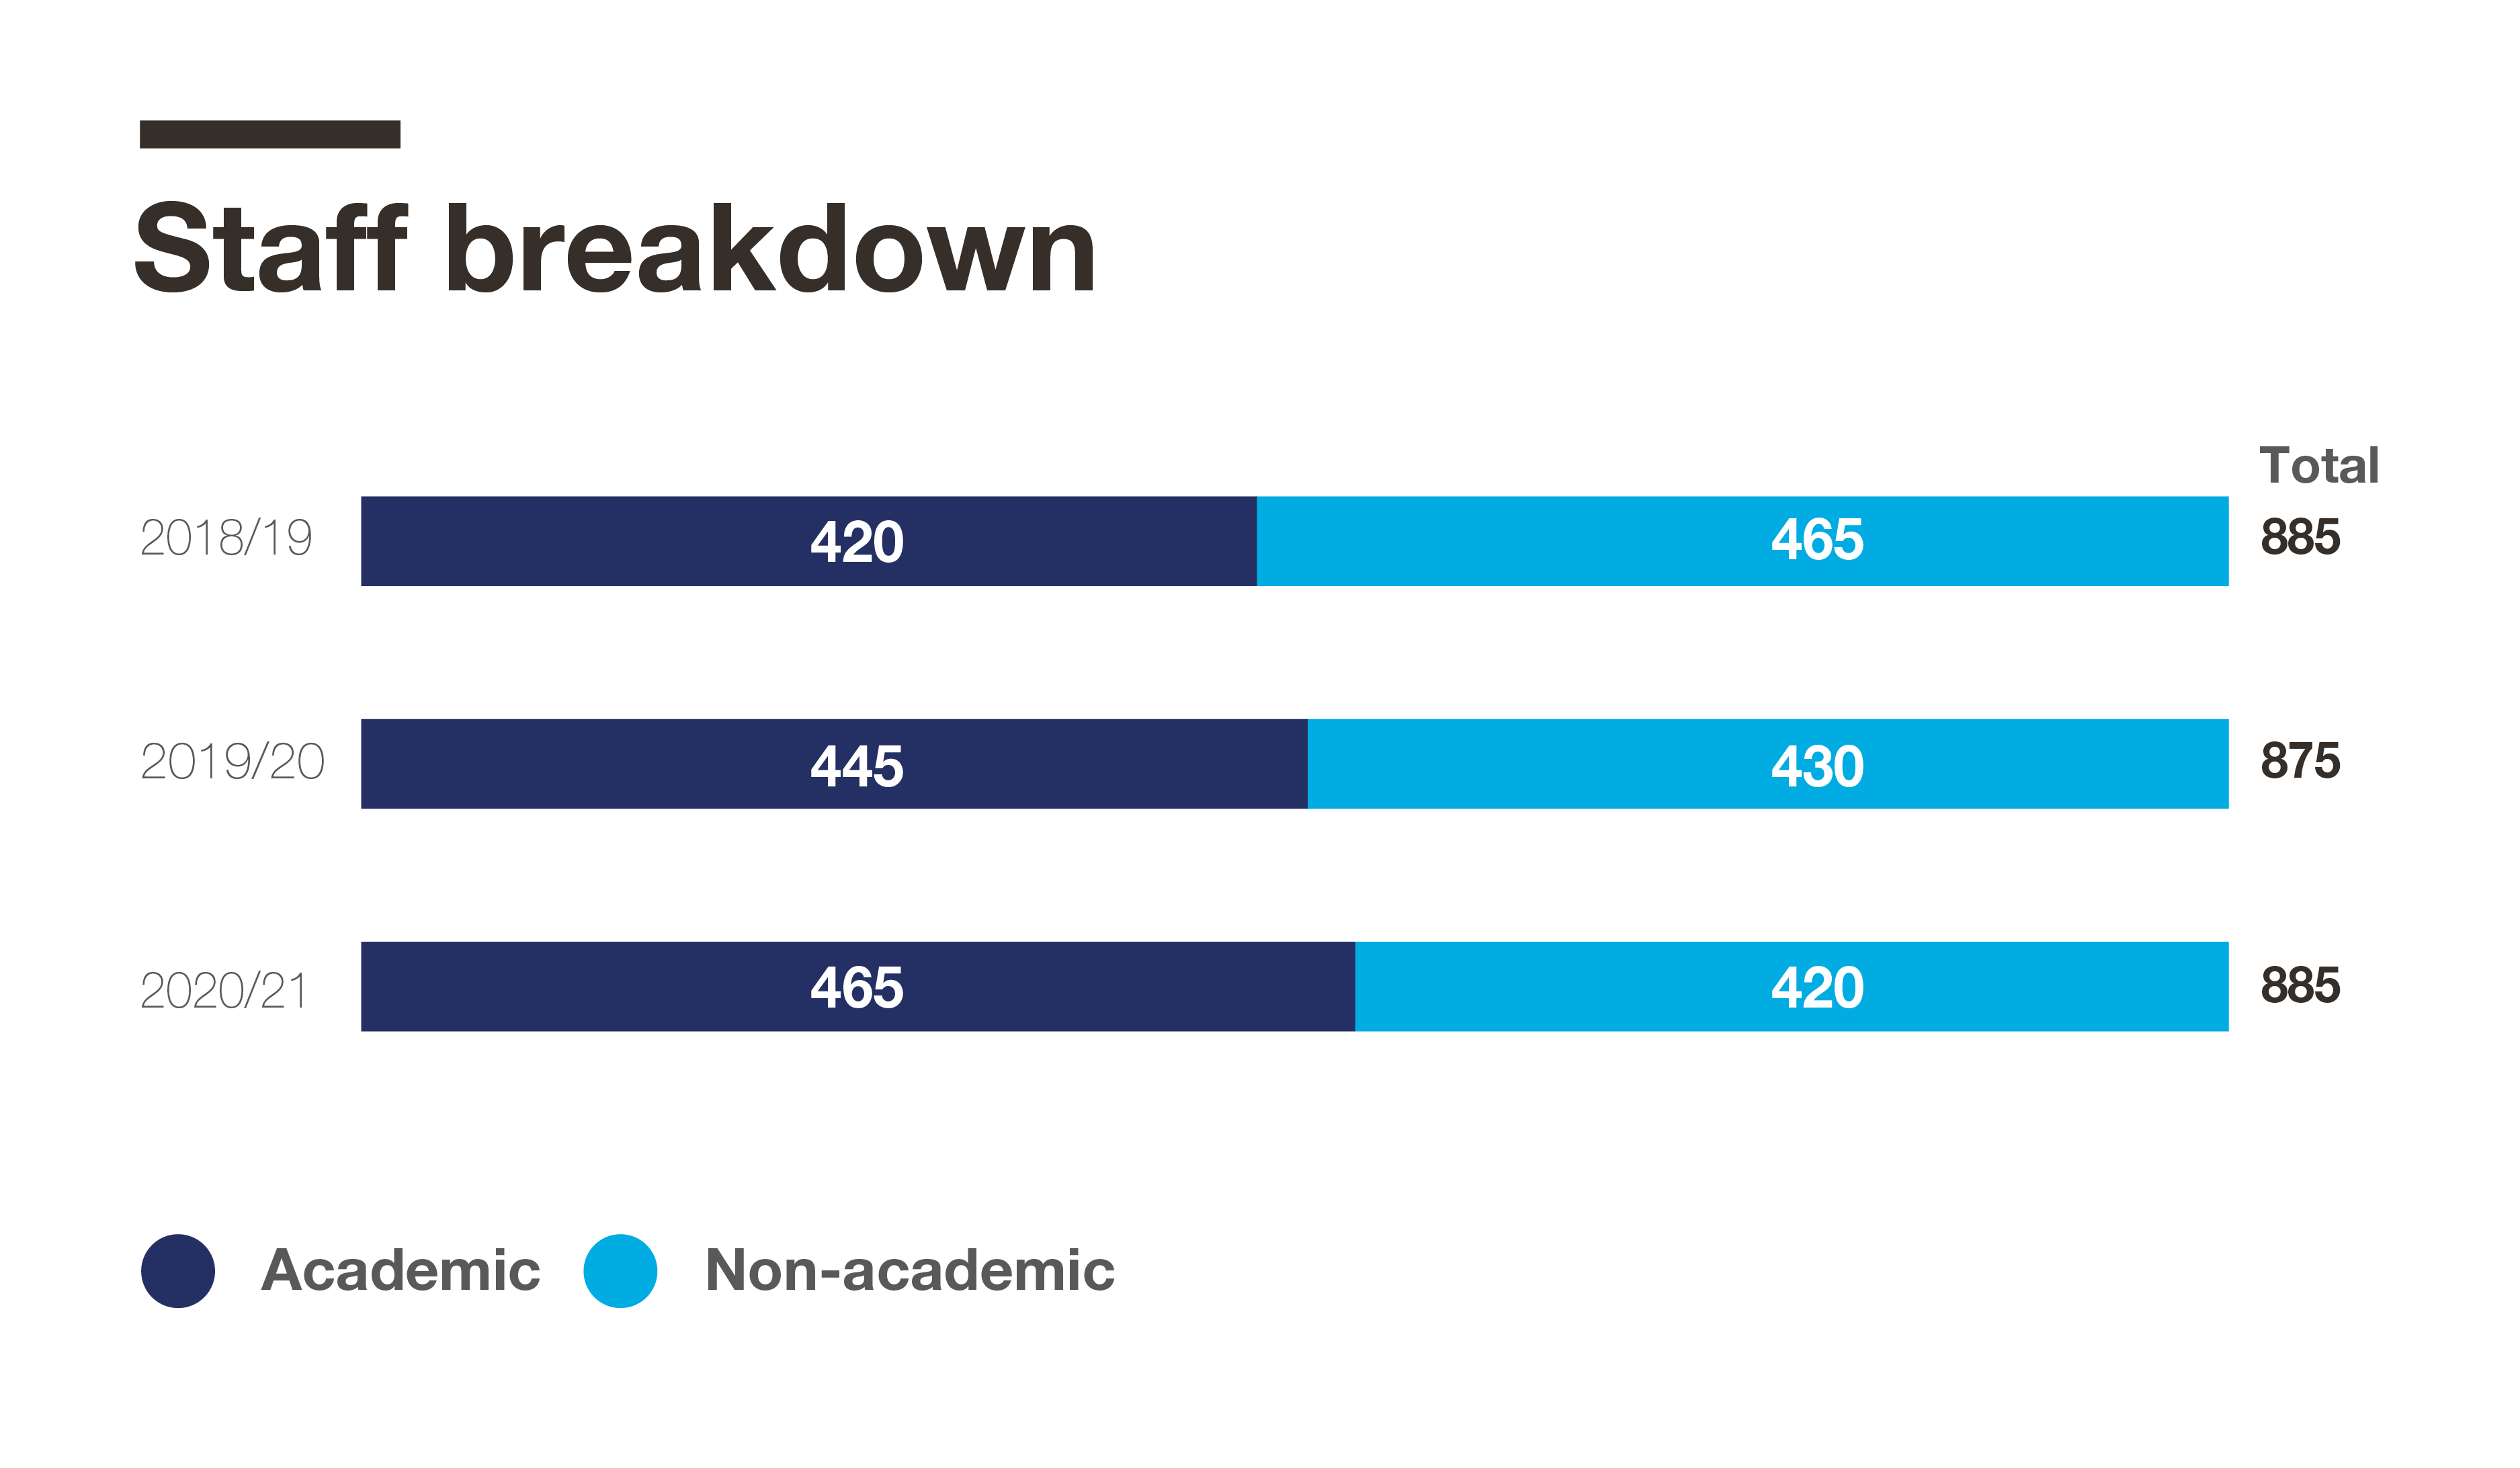
This information is sourced from our Human Resources data and is a snapshot of our active staff profile on 1 December 2021.
The data demonstrates that currently we have a total of 885 members of staff.
- 52% of our staff identify as women
- 62% of our staff identify as White, 32% identify as coming from a racially minoritised group, the largest of which includes 12% who identify as Asian and 12% who identify as Black
- 5% of staff identify as LGBTQIA+ – however there is no data for 36% of staff
- 6% identify as living and working with a disability
- 33% identify as having a religion – however there is no data for 41% of staff
- 58% of our staff are over 45 years old
